


-Photoroom.png)
Pandas: The Data Manipulation Powerhouse of Python
- Subodh Oraw

- Apr 13
- 11 min read

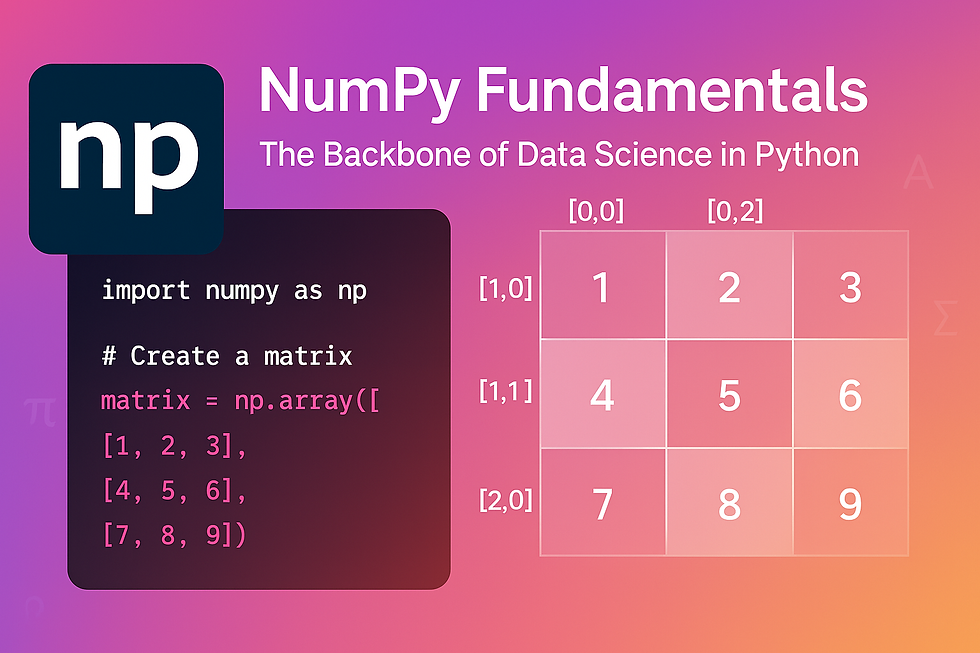
Welcome to day 3 of our Python for Data Science series! In our first post, we covered Python basics, and in our second post, we explored NumPy. Today, we're diving into pandas, the ultimate tool for data manipulation and analysis in Python.
Why pandas is Essential
While NumPy provides the foundation for numerical computing in Python, pandas builds on top of it to create a high-level interface specifically designed for data analysis. Here's why pandas has become indispensable in the data science toolkit:
Intuitive data structures like DataFrames and Series that make working with labeled, tabular data natural
Powerful data cleaning and preparation capabilities to handle messy, real-world data
Built-in data visualization features for quick exploratory analysis
Seamless integration with other data science libraries in the Python ecosystem
Efficient handling of time series data, missing values, and different data types
Getting Started with pandas
Let's begin with the basics: installing and importing pandas.
python# Install pandas if you haven't already
# pip install pandas
# Import pandas with the standard alias
import pandas as pd
import numpy as np # We'll use NumPy occasionallyCore Data Structures: Series and DataFrame
pandas introduces two primary data structures that you'll use constantly:
Series: One-dimensional labeled arrays
Think of a Series as a column in a spreadsheet or a single variable in your dataset:
python# Create a Series from a list
s = pd.Series([10, 20, 30, 40, 50])
print(s)
# 0 10
# 1 20
# 2 30
# 3 40
# 4 50
# dtype: int64
# Create a Series with custom index
s = pd.Series([10, 20, 30, 40, 50], index=['a', 'b', 'c', 'd', 'e'])
print(s)
# a 10
# b 20
# c 30
# d 40
# e 50
# dtype: int64
# Create a Series from a dictionary
s = pd.Series({'a': 10, 'b': 20, 'c': 30})
print(s)
# a 10
# b 20
# c 30
# dtype: int64DataFrame: Two-dimensional labeled data structures
DataFrames are like spreadsheets or SQL tables - they contain rows and columns of data:
python# Create a DataFrame from a dictionary of Series
data = {
'Name': pd.Series(['Alice', 'Bob', 'Charlie', 'David']),
'Age': pd.Series([25, 30, 35, 40]),
'City': pd.Series(['New York', 'Los Angeles', 'Chicago', 'Houston'])
}
df = pd.DataFrame(data)
print(df)
# Name Age City
# 0 Alice 25 New York
# 1 Bob 30 Los Angeles
# 2 Charlie 35 Chicago
# 3 David 40 Houston
# Create a DataFrame from a dictionary of lists
data = {
'Name': ['Alice', 'Bob', 'Charlie', 'David'],
'Age': [25, 30, 35, 40],
'City': ['New York', 'Los Angeles', 'Chicago', 'Houston']
}
df = pd.DataFrame(data)
print(df)
# Name Age City
# 0 Alice 25 New York
# 1 Bob 30 Los Angeles
# 2 Charlie 35 Chicago
# 3 David 40 Houston
# Create a DataFrame from a list of dictionaries
data = [
{'Name': 'Alice', 'Age': 25, 'City': 'New York'},
{'Name': 'Bob', 'Age': 30, 'City': 'Los Angeles'},
{'Name': 'Charlie', 'Age': 35, 'City': 'Chicago'},
{'Name': 'David', 'Age': 40, 'City': 'Houston'}
]
df = pd.DataFrame(data)
print(df)
# Name Age City
# 0 Alice 25 New York
# 1 Bob 30 Los Angeles
# 2 Charlie 35 Chicago
# 3 David 40 HoustonLoading Data into pandas
One of pandas' most useful features is its ability to read data from various file formats:
python# Read from CSV
df = pd.read_csv('data.csv')
# Read from Excel
df = pd.read_excel('data.xlsx', sheet_name='Sheet1')
# Read from JSON
df = pd.read_json('data.json')
# Read from SQL
import sqlite3
conn = sqlite3.connect('database.db')
df = pd.read_sql('SELECT * FROM table_name', conn)
# Read from HTML table
df = pd.read_html('https://example.com/table.html')[0]Exploring Your DataFrame
Once you've loaded your data, pandas provides numerous methods to quickly examine it:
python# Display the first 5 rows
print(df.head())
# Display the last 5 rows
print(df.tail())
# Get a concise summary
print(df.info())
# Get descriptive statistics
print(df.describe())
# Get column names
print(df.columns)
# Get dimensions (rows, columns)
print(df.shape)
# Check for missing values
print(df.isnull().sum())Let's create a sample dataset to work with:
python# Generate a more complex sample dataset
np.random.seed(42) # For reproducibility
dates = pd.date_range('20230101', periods=100)
df = pd.DataFrame({
'Date': dates,
'Category': np.random.choice(['A', 'B', 'C', 'D'], 100),
'Value': np.random.randn(100) * 100,
'Quantity': np.random.randint(1, 100, 100),
'InStock': np.random.choice([True, False], 100)
})Selecting Data in pandas
Selecting and filtering data is a fundamental operation in data analysis. pandas provides multiple ways to do this:
Selecting Columns
python# Select a single column (returns Series)
values = df['Value']
# Select multiple columns (returns DataFrame)
subset = df[['Category', 'Value', 'Quantity']]Selecting Rows with Index-based Selection
python# Using iloc for integer-location based indexing
first_row = df.iloc[0] # First row
first_three_rows = df.iloc[0:3] # First three rows
specific_cells = df.iloc[0:3, 1:3] # First 3 rows, columns 1-2Selecting Rows with Label-based Selection
python# Using loc for label-based indexing
# Assuming we set the Date as the index
df.set_index('Date', inplace=True)
specific_date = df.loc['2023-01-15']
date_range = df.loc['2023-01-15':'2023-01-20']Conditional Selection
python# Filter rows based on a condition
high_values = df[df['Value'] > 50]
# Multiple conditions
filtered = df[(df['Value'] > 50) & (df['Category'] == 'A')]
# Using query method (cleaner for complex conditions)
filtered = df.query('Value > 50 and Category == "A"')Working with Missing Data
Real-world data is rarely perfect. pandas makes handling missing data straightforward:
python# Check for missing values
print(df.isnull().sum())
# Drop rows with any missing values
df_cleaned = df.dropna()
# Drop rows where all values are missing
df_cleaned = df.dropna(how='all')
# Fill missing values with a specific value
df_filled = df.fillna(0)
# Fill missing values with previous valid value
df_filled = df.fillna(method='ffill')
# Fill missing values with next valid value
df_filled = df.fillna(method='bfill')
# Fill missing values with column mean
df_filled = df.fillna(df.mean())Data Transformation
Data rarely comes in the exact format you need. pandas provides powerful tools for reshaping and transforming data:
Adding and removing columns
python# Add a new column
df['Revenue'] = df['Value'] * df['Quantity']
# Delete a column
df.drop('InStock', axis=1, inplace=True)Applying functions to data
python# Apply a function to a column
df['Value_Normalized'] = df['Value'].apply(lambda x: (x - df['Value'].min()) / (df['Value'].max() - df['Value'].min()))
# Apply a function to multiple columns
df[['Value', 'Quantity']] = df[['Value', 'Quantity']].apply(np.log1p)
# Apply a function to the entire DataFrame
df_normalized = df.apply(lambda x: (x - x.min()) / (x.max() - x.min()) if x.dtype == 'float64' else x)Mapping values
python# Map values in a column
category_map = {'A': 'Electronics', 'B': 'Clothing', 'C': 'Books', 'D': 'Food'}
df['Category'] = df['Category'].map(category_map)Handling duplicates
python# Check for duplicate rows
duplicates = df.duplicated().sum()
# Remove duplicate rows
df_unique = df.drop_duplicates()
# Remove duplicates based on specific columns
df_unique = df.drop_duplicates(subset=['Category', 'Value'])Data Aggregation and Grouping
One of pandas' most powerful features is its ability to group data and perform aggregate operations:
GroupBy operations
python# Group by a single column
grouped = df.groupby('Category')
# Get group statistics
print(grouped.mean())
# Multiple aggregations
aggregations = grouped.agg({
'Value': ['mean', 'min', 'max', 'count'],
'Quantity': ['sum', 'mean']
})
# Group by multiple columns
multi_grouped = df.groupby(['Category', 'InStock'])
multi_agg = multi_grouped.mean()Pivot Tables
Create Excel-like pivot tables:
python# Basic pivot table
pivot = df.pivot_table(
values='Value',
index='Category',
columns='InStock',
aggfunc='mean'
)
# More complex pivot table
pivot = df.pivot_table(
values=['Value', 'Quantity'],
index=['Category'],
columns='InStock',
aggfunc={'Value': 'mean', 'Quantity': 'sum'},
fill_value=0,
margins=True
)Time Series Analysis
pandas excels at working with time-based data:
python# Set the Date column as the index
df.set_index('Date', inplace=True)
# Resample to monthly frequency (and take the mean)
monthly = df.resample('M').mean()
# Resample to weekly frequency (and sum)
weekly = df.resample('W').sum()
# Shift data (e.g., for calculating percent change)
df['Previous_Value'] = df['Value'].shift(1)
df['Pct_Change'] = df['Value'].pct_change() * 100
# Rolling statistics
df['Rolling_Mean_7D'] = df['Value'].rolling(window=7).mean()
df['Rolling_Std_7D'] = df['Value'].rolling(window=7).std()Merging and Joining DataFrames
Combining data from different sources is a common task:
python# Create sample DataFrames
customers = pd.DataFrame({
'CustomerID': [1, 2, 3, 4, 5],
'Name': ['Alice', 'Bob', 'Charlie', 'David', 'Eve'],
'Age': [25, 30, 35, 40, 45]
})
orders = pd.DataFrame({
'OrderID': [101, 102, 103, 104, 105],
'CustomerID': [1, 3, 3, 2, 5],
'Product': ['Laptop', 'Phone', 'Tablet', 'Monitor', 'Keyboard'],
'Amount': [1200, 800, 600, 350, 100]
})
# Inner join (only matching CustomerID)
inner_joined = customers.merge(orders, on='CustomerID')
# Left join (all customers, even those without orders)
left_joined = customers.merge(orders, on='CustomerID', how='left')
# Right join (all orders, even for non-listed customers)
right_joined = customers.merge(orders, on='CustomerID', how='right')
# Outer join (all records from both)
outer_joined = customers.merge(orders, on='CustomerID', how='outer')
# Concatenating DataFrames
df1 = pd.DataFrame({'A': [1, 2], 'B': [3, 4]})
df2 = pd.DataFrame({'A': [5, 6], 'B': [7, 8]})
concatenated = pd.concat([df1, df2], ignore_index=True)Data Visualization with pandas
pandas provides convenient methods for basic plotting, built on matplotlib:
pythonimport matplotlib.pyplot as plt
# Create a sample time series
dates = pd.date_range('20230101', periods=100)
data = pd.DataFrame({
'A': np.random.randn(100).cumsum(),
'B': np.random.randn(100).cumsum(),
'C': np.random.randn(100).cumsum()
}, index=dates)
# Line plot
data.plot(figsize=(10, 6), title='Time Series Plot')
plt.savefig('time_series.png')
# Bar plot
data.iloc[-10:].plot.bar(figsize=(10, 6), title='Bar Plot')
plt.savefig('bar_plot.png')
# Histogram
data.plot.hist(bins=20, alpha=0.5, figsize=(10, 6), title='Histogram')
plt.savefig('histogram.png')
# Scatter plot
data.plot.scatter(x='A', y='B', figsize=(10, 6), title='Scatter Plot', alpha=0.5)
plt.savefig('scatter_plot.png')
# Box plot
data.plot.box(figsize=(10, 6), title='Box Plot')
plt.savefig('box_plot.png')Exporting Data from pandas
Once you've finished your analysis, you'll often want to save your data:
python# Export to CSV
df.to_csv('output.csv')
# Export to Excel
df.to_excel('output.xlsx', sheet_name='Sheet1')
# Export to JSON
df.to_json('output.json')
# Export to SQL
import sqlite3
conn = sqlite3.connect('output.db')
df.to_sql('table_name', conn, if_exists='replace')Practical Example: Customer Purchase Analysis
Let's put everything together with a practical example:
python# Create a more realistic sample dataset
np.random.seed(42)
dates = pd.date_range('20220101', periods=1000)
customers = ['Customer_' + str(i) for i in range(1, 101)]
products = ['Product_A', 'Product_B', 'Product_C', 'Product_D', 'Product_E']
regions = ['North', 'South', 'East', 'West']
sales_data = pd.DataFrame({
'Date': np.random.choice(dates, 1000),
'CustomerID': np.random.choice(customers, 1000),
'Product': np.random.choice(products, 1000),
'Region': np.random.choice(regions, 1000),
'Quantity': np.random.randint(1, 10, 1000),
'UnitPrice': np.random.uniform(10, 100, 1000).round(2),
})
# Calculate the total price for each transaction
sales_data['TotalPrice'] = sales_data['Quantity'] * sales_data['UnitPrice']
# Set the date as index and sort
sales_data.set_index('Date', inplace=True)
sales_data.sort_index(inplace=True)
# Analyze sales by product
product_analysis = sales_data.groupby('Product').agg({
'Quantity': 'sum',
'TotalPrice': 'sum',
'CustomerID': pd.Series.nunique # Count unique customers
}).rename(columns={'CustomerID': 'UniqueCustomers'})
# Analyze sales by region
region_analysis = sales_data.groupby('Region').agg({
'TotalPrice': 'sum',
'Quantity': 'sum'
})
# Find the top 10 customers by total purchase amount
top_customers = sales_data.groupby('CustomerID')['TotalPrice'].sum().nlargest(10)
# Monthly sales trend
monthly_sales = sales_data.resample('M')['TotalPrice'].sum()
# Cross-tabulation of products vs regions (pivot table)
product_region = pd.pivot_table(
sales_data,
values='TotalPrice',
index='Product',
columns='Region',
aggfunc='sum'
)
# Plot the results
fig, axes = plt.subplots(2, 2, figsize=(14, 10))
# Product analysis
product_analysis[['TotalPrice']].plot(
kind='bar',
ax=axes[0, 0],
title='Sales by Product'
)
axes[0, 0].set_ylabel('Total Sales ($)')
# Regional analysis
region_analysis[['TotalPrice']].plot(
kind='pie',
ax=axes[0, 1],
title='Sales by Region',
autopct='%1.1f%%',
ylabel=''
)
# Monthly trend
monthly_sales.plot(
ax=axes[1, 0],
title='Monthly Sales Trend'
)
axes[1, 0].set_ylabel('Total Sales ($)')
# Product-Region heatmap
import seaborn as sns
sns.heatmap(
product_region,
annot=True,
fmt='.0f',
cmap='YlGnBu',
ax=axes[1, 1]
)
axes[1, 1].set_title('Product Sales by Region')
plt.tight_layout()
plt.savefig('sales_analysis.png')Optimizing pandas Performance
When working with large datasets, performance matters. Here are some tips:
Use appropriate data types: Converting columns to their proper data types (e.g., using pd.to_numeric(), pd.to_datetime(), or category data types) can significantly reduce memory usage.
Vectorize operations: Avoid loops and apply operations on entire columns or DataFrames.
Use query() and eval(): For complex filtering operations, these methods can be faster.
Consider chunking: Process large files in chunks using the chunksize parameter in read_csv().
Use inplace=True when appropriate to avoid creating unnecessary copies.
Consider alternatives for very large data: For truly massive datasets, libraries like Dask or Vaex can extend pandas' functionality.
Conclusion
pandas is a game-changer for data analysis in Python. Its intuitive data structures, powerful data manipulation capabilities, and seamless integration with the broader Python ecosystem make it an essential tool for any data scientist.
In this post, we've covered the fundamentals of pandas, from creating and manipulating DataFrames to performing complex data analysis tasks. While we've covered a lot, pandas offers even more functionality that you'll discover as you tackle real-world data problems.
In our next post, we'll dive into data visualization with Matplotlib and Seaborn, where we'll learn how to create professional, publication-quality visualizations of our data.
Exercise Challenge
To reinforce your pandas skills, try these exercises:
Download a real-world dataset (e.g., from Kaggle) and use pandas to load and explore it.
Clean the dataset by handling missing values, removing duplicates, and correcting data types.
Perform at least three types of analysis on the dataset (e.g., groupby, pivot tables, time series).
Create at least two visualizations to illustrate your findings.
Export your cleaned dataset and analysis results to a new file.
Share your solutions in the comments, and we'll provide feedback!

Comments